Make the information easier to see.

Dotte creates charts, maps and interactive tools that help readers compare figures, locate patterns and explore data. Information design and development work together, with the format chosen for the question and the people using it.

Discuss your project

Start with the question the data answers

A useful visualisation makes a particular relationship understandable. We begin with what your audience needs to compare or discover, then choose the format, labels and context that support that purpose. The aim is to reduce the work a reader must do to interpret the information.

Read allRead less

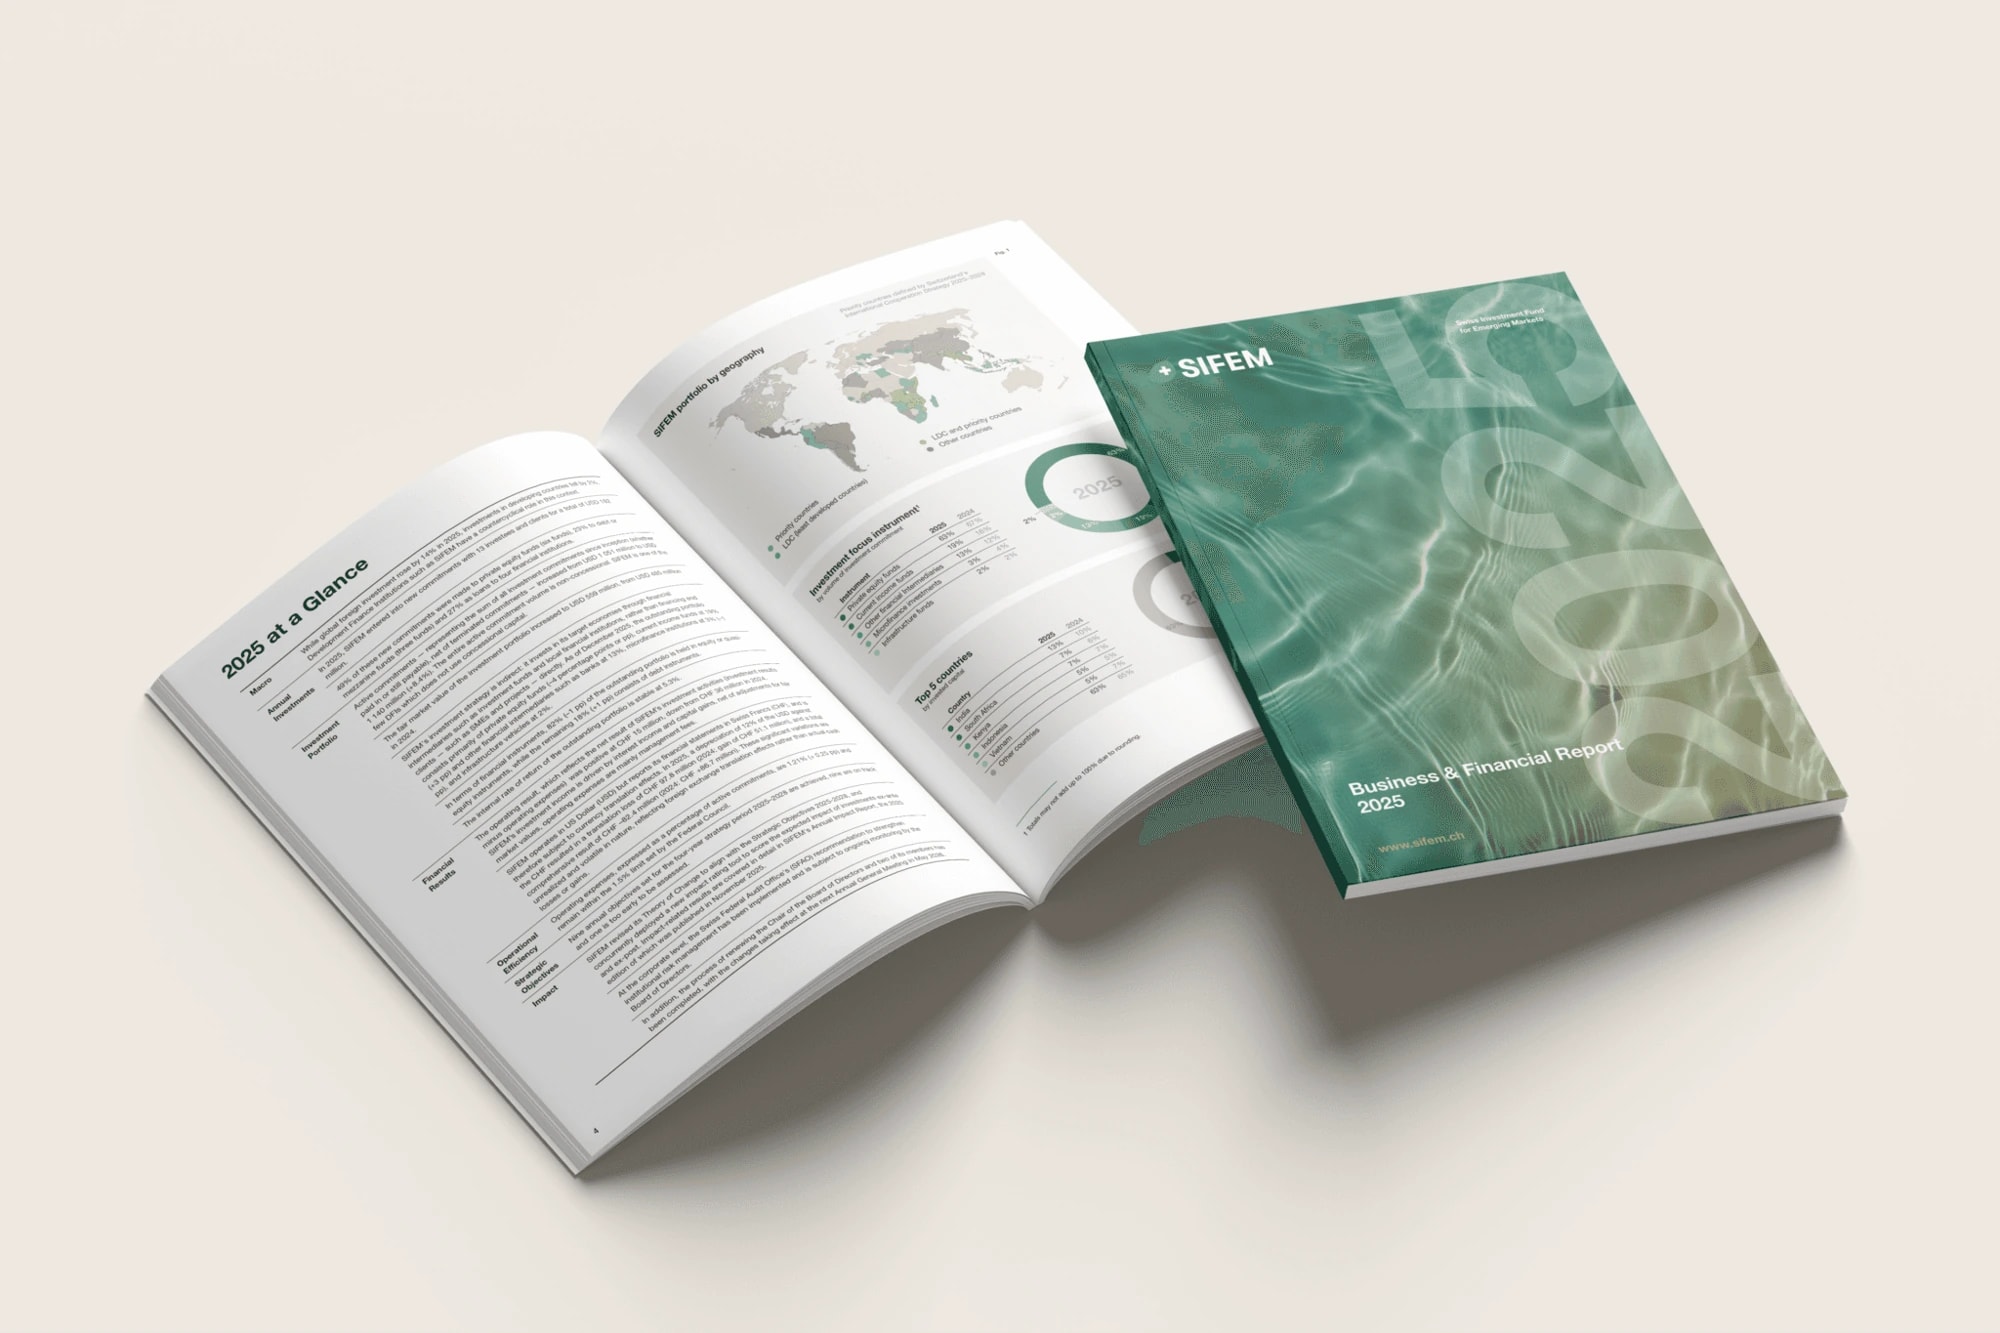
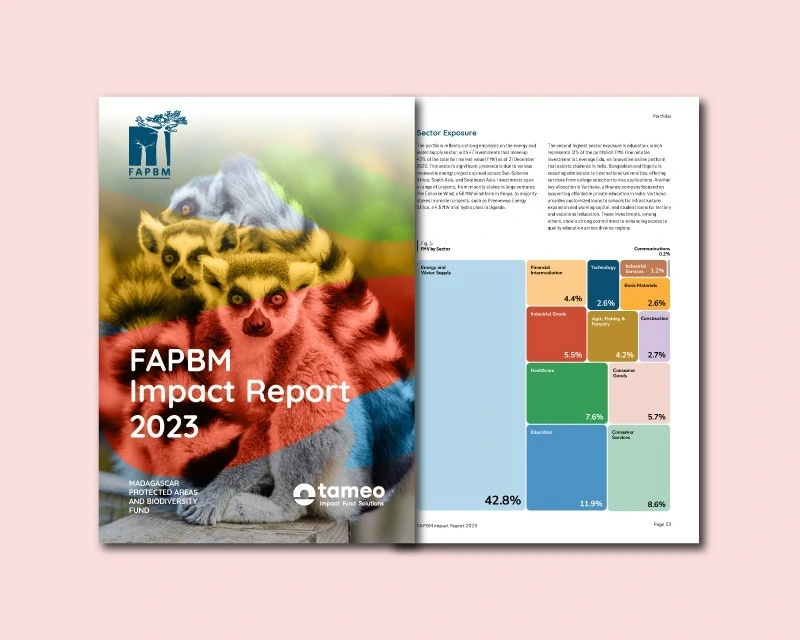
My report design includes charts, tables and maps for financial, impact and conservation publications. The biodiversity-report case study describes a portfolio treemap within an editorial layout; the business and financial report brings several types of data into a consistent publication.

Choose the right way to publish

Some information works best as a static figure that can be printed, annotated and cited. Other material benefits from filters, tooltips or linked views that let readers investigate it themselves. We choose the format around the data and its use, rather than adding interaction by default.

I build with React, D3.js and Python/Plotly, and can create supporting tools for extraction and processing where the input workflow needs attention. The scope defines the source data, refresh process and review responsibilities. You approve the underlying figures and interpretations before publication.

What we can deliver

  • Charts and maps for reports and presentations
  • Interactive visualisations for websites
  • Consistent labels, legends and visual systems
  • Supporting data extraction and processing tools
  • Source files, export formats and technical handover

How we work

  1. Review the data

    We examine a sample, its definitions and the question to answer, then agree the source, output and validation responsibilities.

  2. Prototype the view

    We test the chart choice and any interactions with real data, checking labels, units and readable fallbacks.

  3. Build and document

    We implement the approved view, test the agreed data workflow and deliver the files or integration with documentation.

Frequently asked questions

Can a chart appear in both a report and a website?

Yes. We can plan static and interactive versions together, with shared definitions, colours and labels adapted to each format.

Can the visualisation update automatically?

Where there is a dependable data source, an update workflow can be included. We agree access, frequency and ownership before building it.

Do you check the data?

I check the structure, rendering and consistency within the agreed scope. The data owner remains responsible for approving the source figures and substantive conclusions.

Explore the work

Tell me about your project, what you need and your timeline.

Your information is used to respond to your enquiry. Privacy